All Map Product Types
Each product type explained in detail — purpose, applications, and technical specifications.
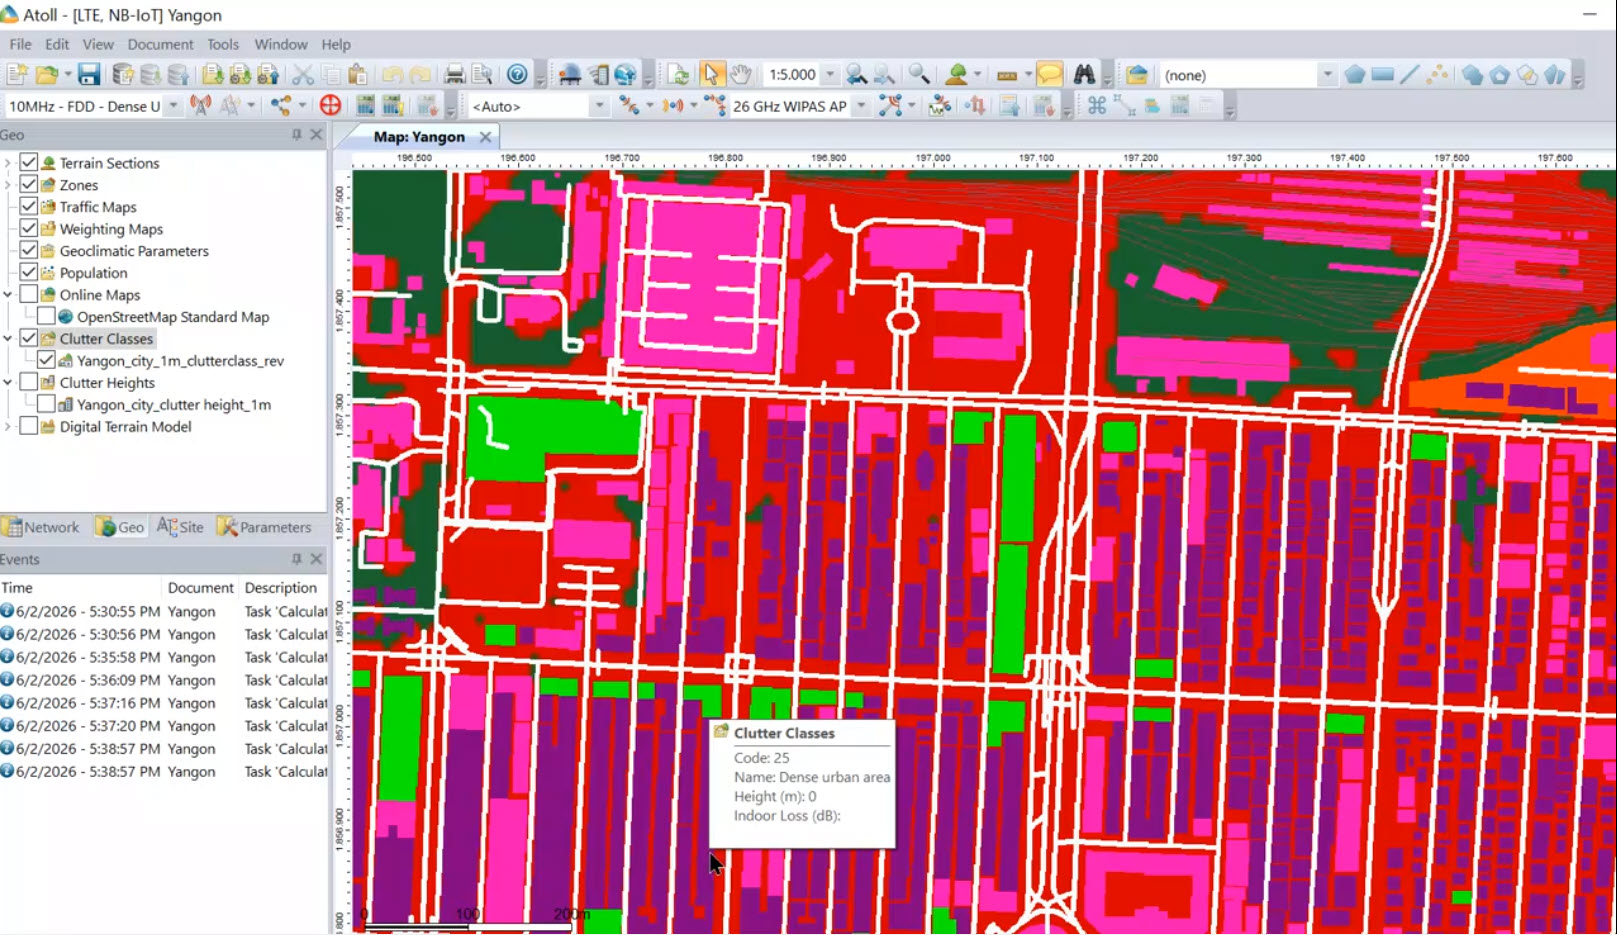
Clutter Class Map
A clutter class map classifies every square metre of the city into a land-use type — urban, dense urban, vegetation, water, road, industrial, and more. Our dataset delivers 26 standard classes + custom classes (Code C — configurable per client) at 1 m resolution. Each class carries a distinct propagation loss value assigned directly in Atoll Clutter Properties or Infovista Planet — no conversion or pre-processing required.
In telecommunications, clutter maps are crucial for signal propagation modeling, as different land cover types significantly affect the strength and reach of radio signals. By understanding the distribution of clutter types, engineers can better design and optimize communication networks.
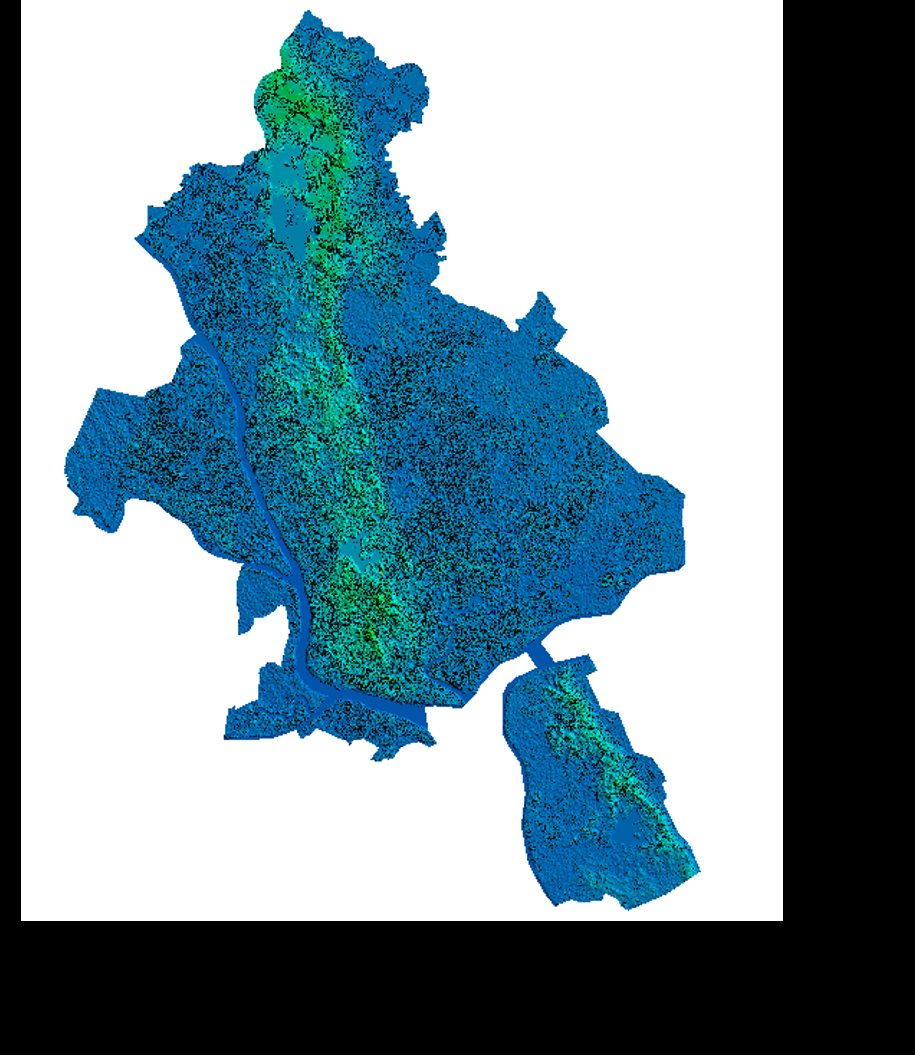
Height / Terrain Model (DSM + DTM)
A height map is a specialized digital map that represents the elevation of the earth's surface in detail. It provides a visual depiction of topography — hills, valleys, mountains, and flat areas. In addition to natural features, our height maps include man-made structures like buildings, adding a critical layer of urban detail.
In telecommunications, height maps are used to model and predict how buildings might obstruct or reflect signals, helping to optimize antenna placement and infrastructure. Combined with building height data, planners gain a complete 3D view of the environment for precise signal attenuation modeling.
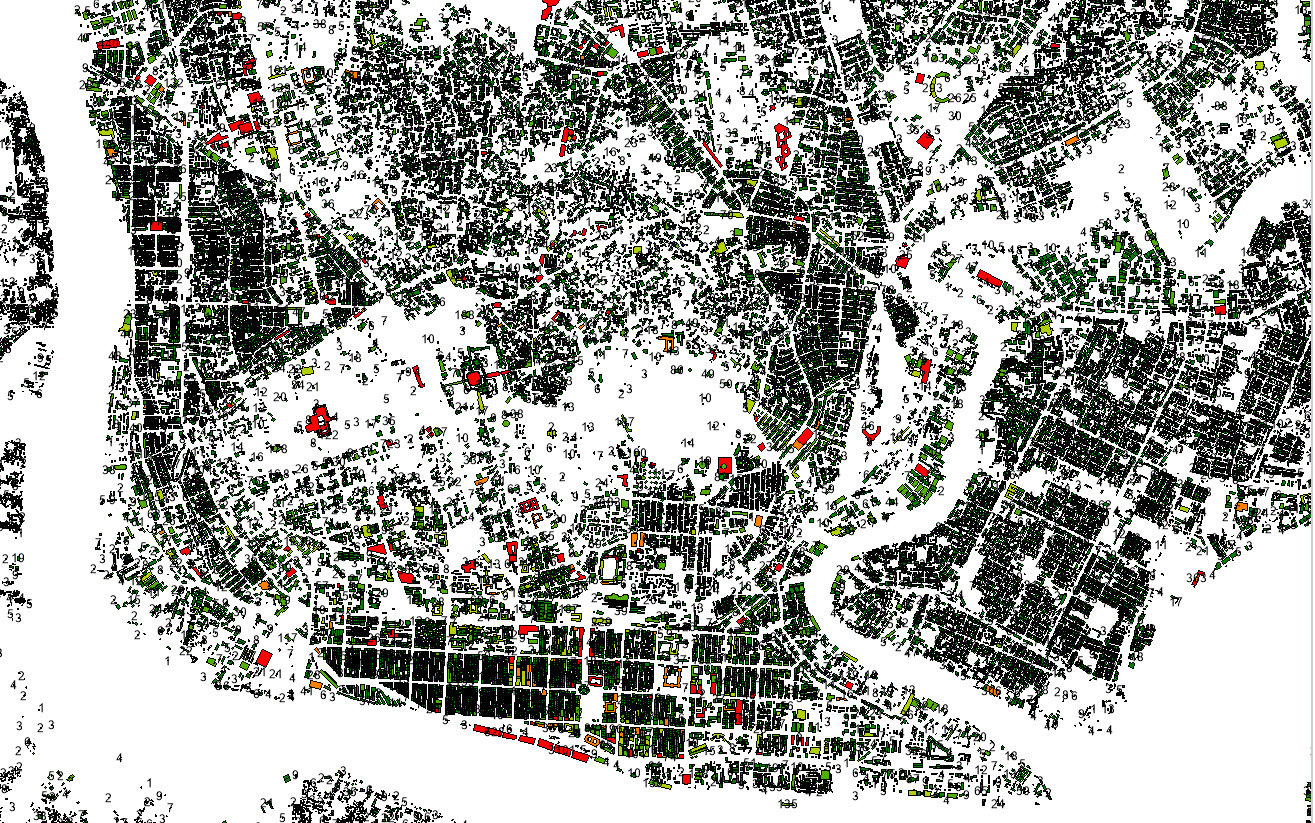
Population Map
Our population map delivers per-building population distribution at 1 m resolution — population apportioned to each individual building polygon using floor count, footprint area, and clutter class as weighting factors. A 12-storey apartment block receives proportionally more population than a single-storey house in the same ward, reflecting physical reality.
Delivered as MapInfo .TAB vector layers (not raster). Includes POP_2024 (2024 Census baseline) and POP_EST (current-year projection) per building. Non-residential buildings are masked via the CLUTTER_CD attribute. Essential for 5G small-cell planning, FWA premises qualification, and smart city demand analytics.
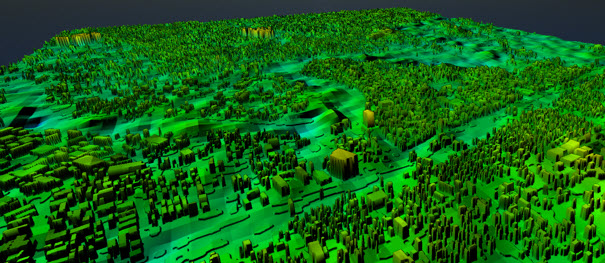
Building Height Map
Our high-resolution building height map is a detailed digital representation showing the variations in building heights across a specific area. This map provides a clear and precise view of how tall buildings are, allowing users to see differences in height from one structure to another across the urban landscape.
In telecommunications, these maps help design and optimize wireless networks by identifying potential obstacles that could block or reflect signals. They also support city planning analysis to determine indoor and outdoor coverage areas, essential for 4G LTE and 5G deployments.
Building Polygon
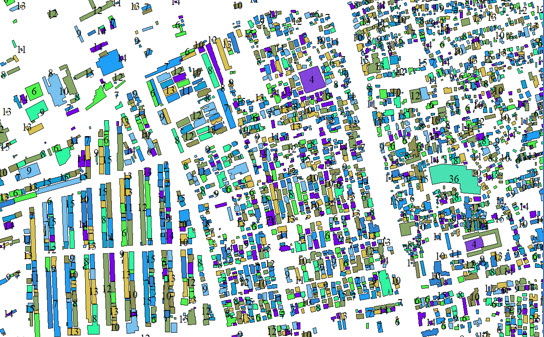
Our building footprint polygon is a geometric representation of a building's outline on the ground, typically shown on a map. These polygons provide a precise view of the spatial distribution of buildings across a specific area, showing the exact location, shape, and size of each building's base.
Our building footprints are more complete than OSM map data. Building shape polygons are created using an automated production process of object recognition from high-resolution satellite imagery. Urban planners, disaster management teams, and infrastructure developers all rely on these datasets for zoning, flood risk assessment, and land use optimization.
Population Distribution Polygon
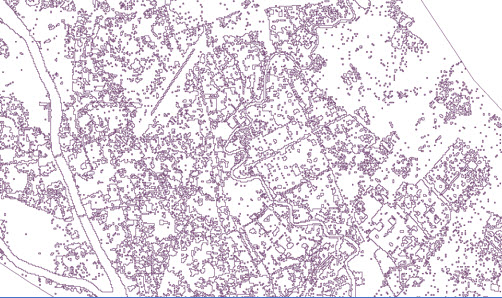
Our population distribution polygon map is a geographical tool that visually represents how people are spread across a given area. The map divides the region into polygons based on administrative boundaries like cities and neighborhoods — each indicating the population within that specific area.
This type of map is particularly useful for identifying patterns of population concentration. It can highlight densely populated urban centers, moderate suburban areas, and sparsely populated rural regions — valuable for urban planning, infrastructure development, and resource allocation.